Dumping EEPROM contents
 After lots of testing, reading code and checking, I came to the conclusion that the MDF file for the Hasselt module is bad. That statement goes for any version of the MDF that I was able to find (SourceForge, forum posts, …) So that means we’re on our own and will need to reconstruct it. To be able to do that, we’ll need a way to verify what values VSCP Works has written to our node’s EEPROM memory. This article describes some code to dump the EEPROM memory over the serial connection which we set up earlier.
DumpEEPROM() function
First of all we’ll add a function DumpEEPROM() to our code. I added a prototype before the ISR routines, and the declaration after the main() function. I’ve put it between #ifdef statements so that it will only be compiled if #define SERIAL_DEBUG_DUMPEEPROM is set. This way we can prevent the function from being included in any production versions.
void DumpEEPROM(void) {
#ifdef SERIAL_DEBUG_DUMPEEPROM
	unsigned int i, j;                           //i = element index, j = column index
	unsigned int StartLocation = 0;            //TODO: change to actual VSCP EEPROM location
	unsigned int EndLocation = 1023; //max 1023   //TODO: change to actual VSCP EEPROM location
	unsigned int colums = 8;

	if (EndLocation > 1023)                                 // prevent reading beyond EEPROM memory end
		EndLocation = 1023;

	sprintf(debugstring,
			"\r\n*** DumpEEPROM(), StartLocation = %i, EndLocation = %i, colums = %i\r\n",
			StartLocation, EndLocation, colums );
	daf_puts1USART(debugstring);

	for (i=0; i < ( (EndLocation - StartLocation) / colums ) ; i++) {   //for each line
		for (j=0; j<colums; j++) {               //for each element in this row
			sprintf(debugstring,                 //print EEPROM location and its content
				"%4i:0x%02X ",
				( (EndLocation - StartLocation) / colums * j + i + StartLocation),
				readEEPROM( (EndLocation - StartLocation) / colums * j + i + StartLocation) );
			daf_puts1USART(debugstring);         //print to USART
		}
		daf_putrs1USART("\r\n");                 //next line
	}
#endif
}
This function first announces that it has started, prints the start and end of the EEPROM memory location it will display, and shows how many columns the data will be formatted in.
It then runs a for loop using index i, which is the index for the EEPROM location. It will run for as many rows are needed to display all values for the chosen locations, which is the amount of values divided by the number of rows.
Inside of this loop is a second for loop, which displays each element of that row. It uses index j, which is the column number. Within this loop each element is displayed; first its location in EEPROM, and then its value in HEX. These values are separated by a semicolon.
Calling the DumpEEPROM() function
We’ll need to run the function every time we want to dump the contents of the EEPROM memory to console. We’ll abuse the INIT_BUTTON for this purpose. The INIT_BUTTON is checked every 10ms by the low ISR routine, where the variable vscp_initbtncnt is increased up to a maximum value of 101. The main program loop checks if the INIT_BUTTON was released, and if so checks if it was held for 1 second (10ms * 100). It then performs some actions depending on the state of the node (VSCP_STATE_x). At the end_vscp_initbtncnt_ is reset for the next pass.
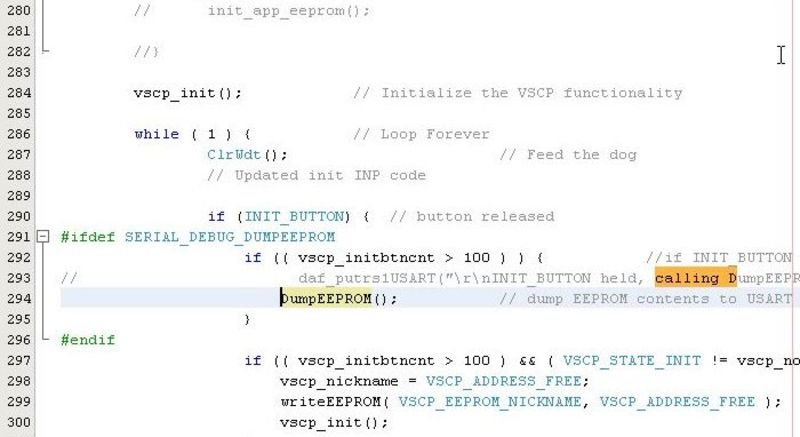
To execute our code, we’ll add a similar action, albeit without looking at the VSCP state. Add the following code to the main program loop, directly under the if (INIT_BUTTON) statement:
#ifdef SERIAL_DEBUG_DUMPEEPROM
					if (( vscp_initbtncnt > 100 ) ) {           //if INIT_BUTTON was held (and released)
						DumpEEPROM();           // dump EEPROM contents to USART
					}
#endif
As a side effect of calling DumpEEPROM() using the INIT_BUTTON, pressing the button will also trigger vscp_init() which will re-initialize the node. But that doesn’t matter much for our testing.

Dumping EEPROM contents
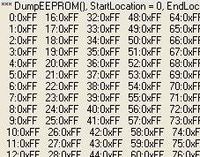
Now whenever we press and hold the INIT_BUTTON for more than 1 second, the contents of the EEPROM memory will be dumped to the console in a nicely formatted table, ready for comparison with the MDF registers.

EEPROM view in MPLAB
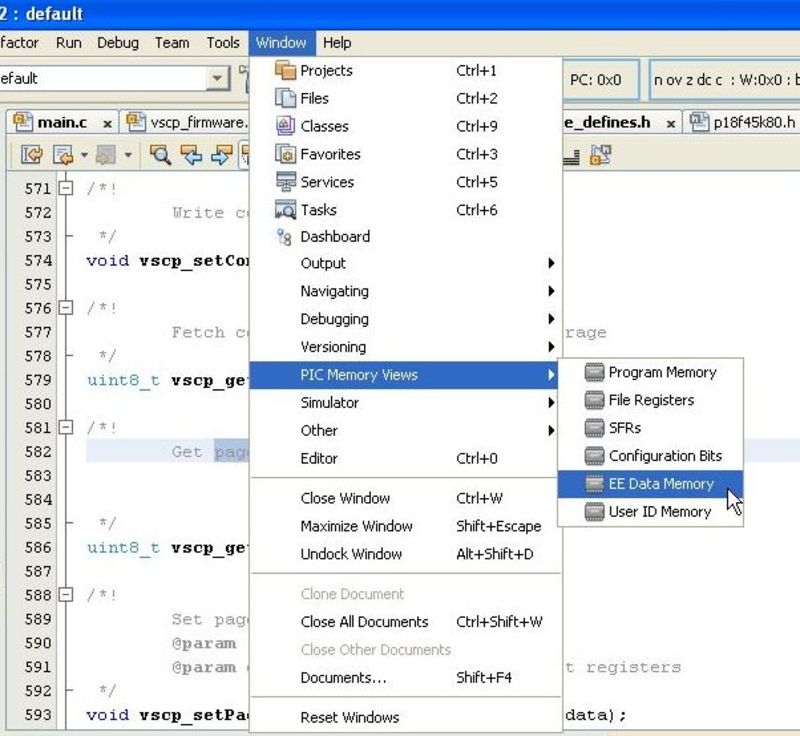
MPLAB X has a standard functionality to view the EEPROM memory in the PIC. Select the menu Window - PIC Memory Views - EE Data Memory.

This opens the opens the EEPROM window, in which you can see the contents of the PIC’s EEPROM. I find it awkwardly presented and generally do not like it, hence the function I wrote as explained above.

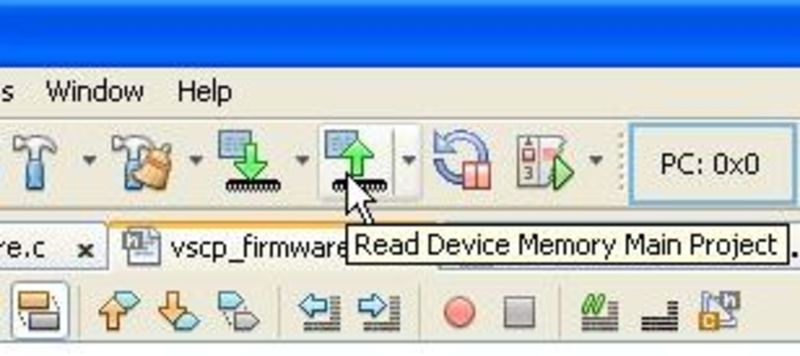
This window is not refreshed automatically, to re-fresh it you’ll need to hit the Read device memory main project button in the Run toolbar every time you want to investigate the contents of EEPROM.
